After you've successfully installed the package and received your personal token, you're ready to import the ChannelAttribution Pro library in your Notebook. You can get the package and a token here.
from ChannelAttributionPro import *
token='yourtoken'
Once you have set up the necessary paths and installed the library, it's time to turn our focus to attribution modeling. This process is key to understanding which touchpoints are most influential in leading to conversions. A practical starting point might be to explore simpler models such as first-touch and last-touch attribution.
result = heuristic_models(attribution_df, var_path="path", var_conv="total_conversions",cha_sep=">")
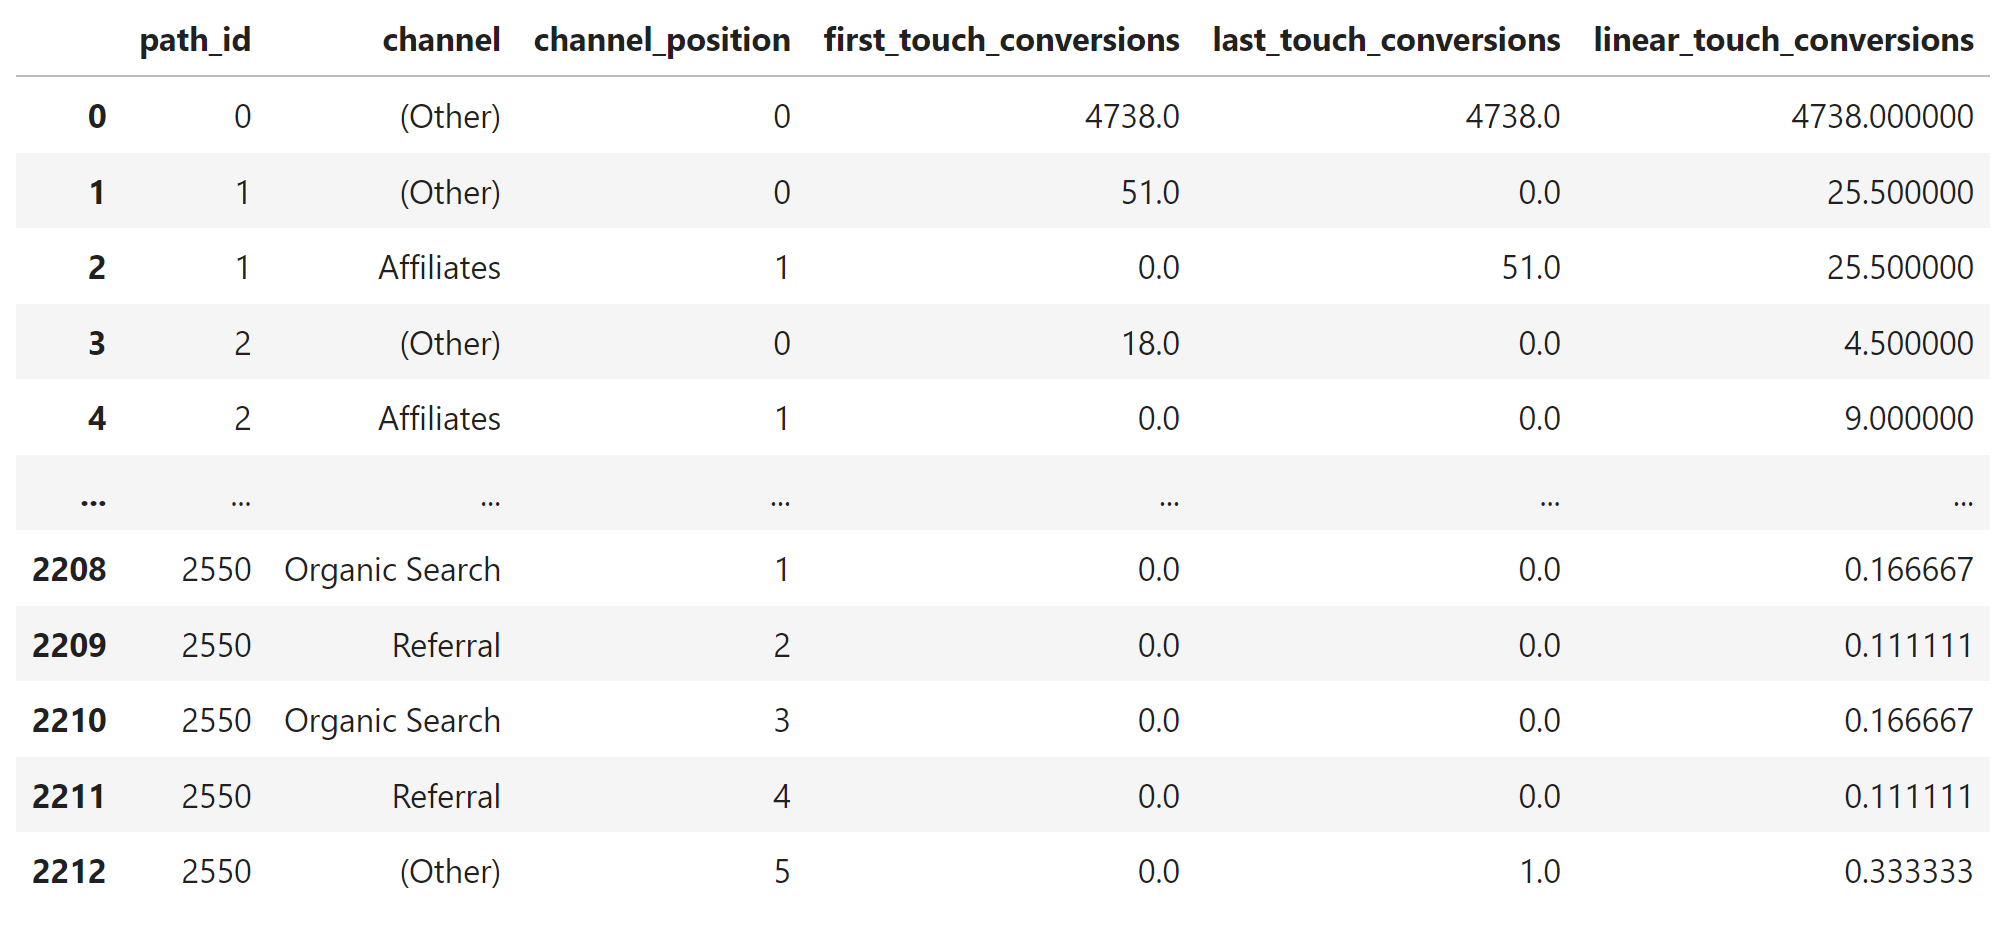
The chart above illustrates the output of our heuristic attribution models.
- First Touch Attribution: In our analysis, 'Organic Search' stands out significantly, suggesting it is often the initial point of contact for customers who convert.
- Last Touch Attribution: The prominence of 'Other' in the Last Touch model suggests that it often serves as the decisive interaction leading to conversions. This could indicate that activities grouped under 'Other' are effectively capturing users' attention at crucial decision-making moments.
- Linear Touch Attribution: In the Linear Touch model, 'Other' also shows strong performance, highlighting its steady engagement throughout the marketing funnel.
Now we move to the interesting part which is Markov chain modeling.
markov_result_val = markov_model(Data=attribution_df,
                 var_path="path",
                 var_conv="total_conversions",
                 var_null="total_null",
                 var_value="total_conversion_value",
                 cha_sep=">")
markov_att_val = markov_result_val["attribution"]
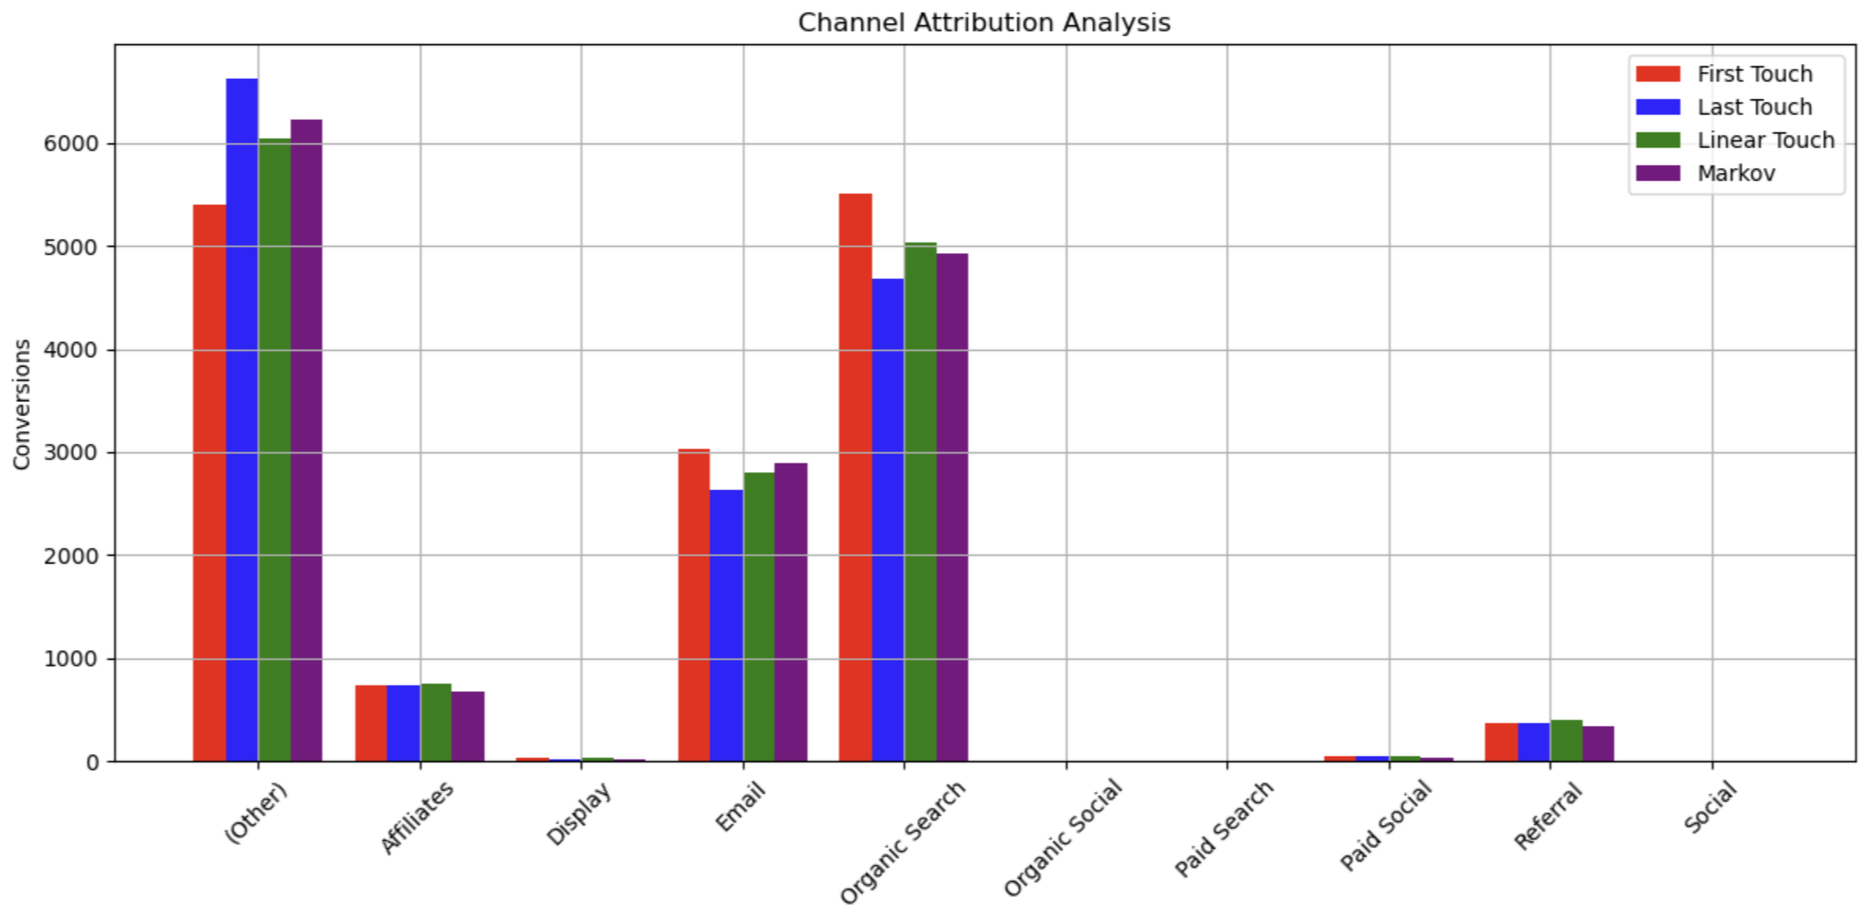
The chart above presents an expanded analysis of channel attribution, incorporating both heuristic and Markov models. The inclusion of the Markov model offers a new perspective, highlighting 'Organic Search' and 'Email' as particularly influential, suggesting their roles are crucial in influencing customer decisions throughout their path to conversion.
To get an idea of how the different channels affect a user's journeys we can also look at the transition probability matrix, which can be visualized in a heatmap. To get the transition matrix as output you should set the 'flg_out_tran_mtx=1' in your function.
markov_result_trans = markov_model(Data=attribution_df,
                 var_path="path",
                 var_conv="total_conversions",
                 var_null="total_null",
                 var_value="total_conversion_value",
                 flg_out_tran_mtx = 1, #if 1, transition matrix along with attribution is computed and returned. If 2, only transition matrix is computed and returned
                 cha_sep=">")
markov_trans_val = markov_result_trans["transition_matrix"]
markov_trans_val
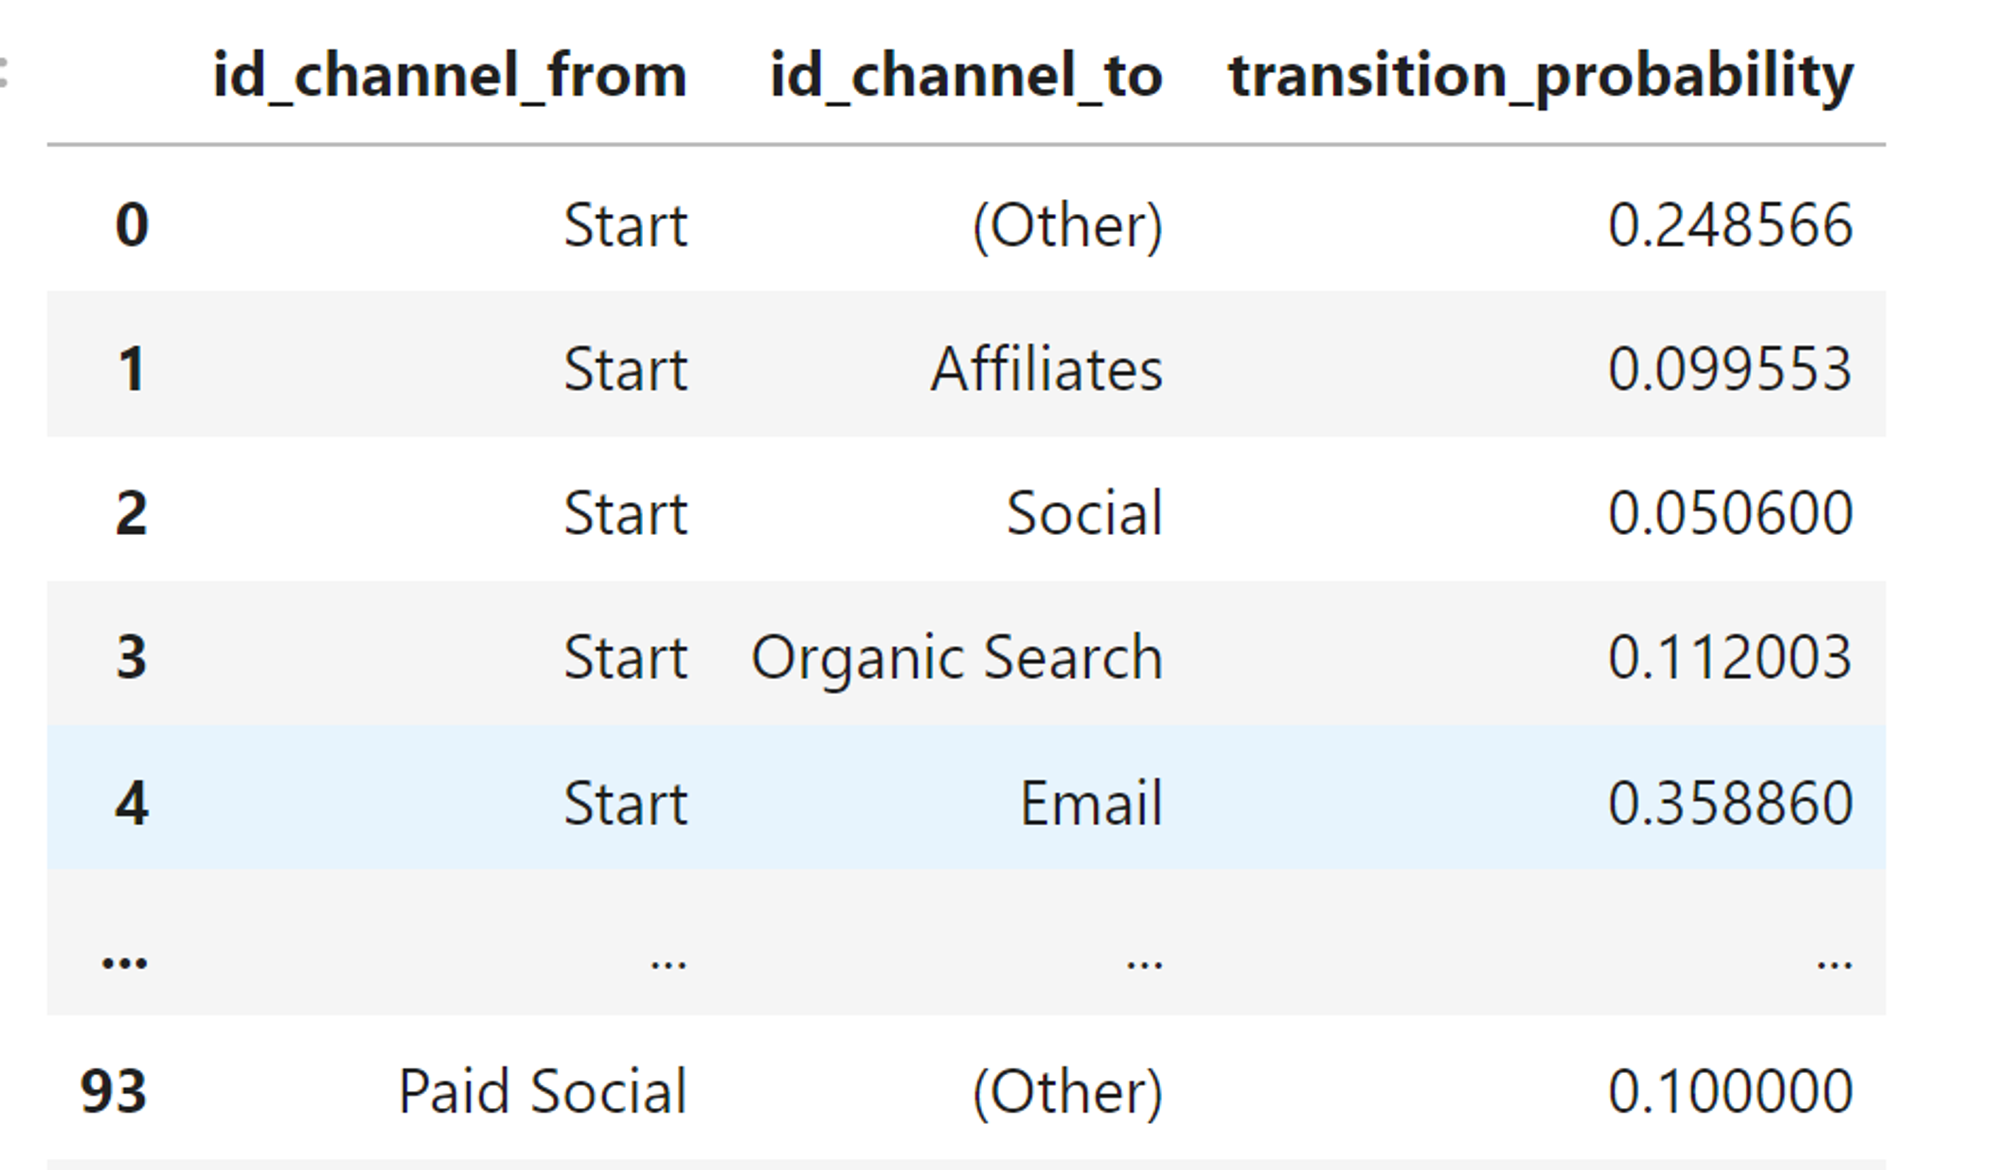
Using the heat map and the plots above we not only gain insights into how each marketing channel is driving conversions, but we also gain critical information around how our channels are interacting with each other, driving users one channel to another. Given the number of touchpoints a user today typically faces, this information can prove to be extremely valuable and allows us to optimize our multi-channel customer journeys accordingly. Using the Markov Chain approach outlined in this article will allow your attributions to more accurately reflect how your users are interacting with your marketing.
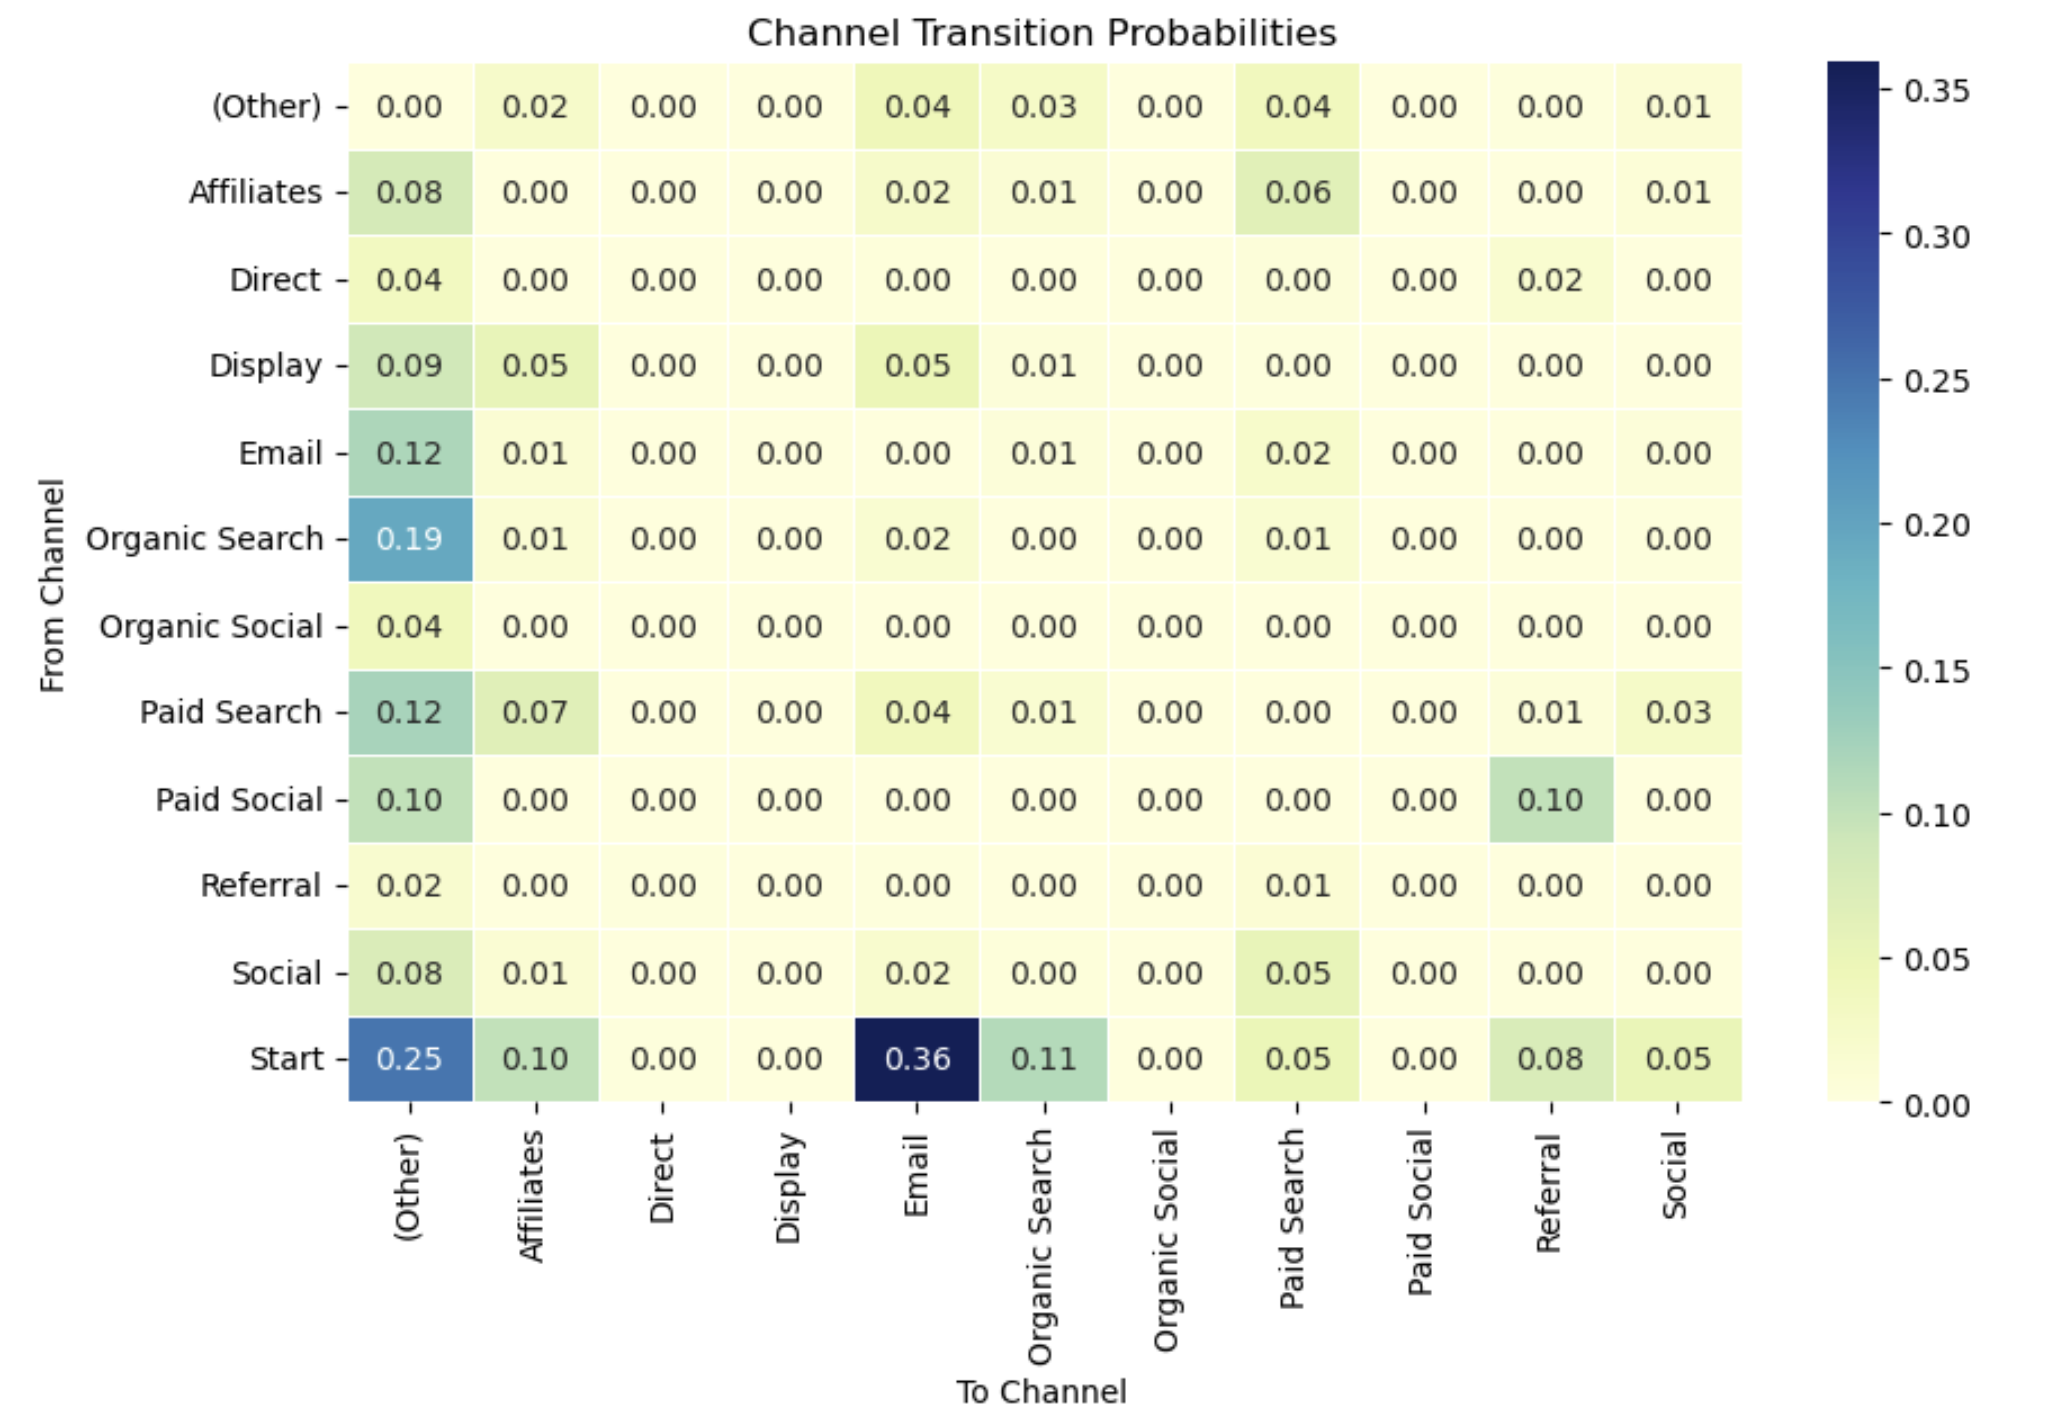
You can also utilize the Markov Chain Model to strategically allocate your marketing budget. The objective is to reallocate resources towards channels that have proven to be more effective in influencing customer decisions and driving conversions.
To begin, we set the total marketing budget and the percentage of this budget that we wish to reallocate based on the model's findings. We then invoke the markov_model function to generate the attribution analysis for our marketing channels:
total_budget_new=1000000 #<-user define
perc_reall=0.1 #<-user define

res_markov=markov_model(attribution_df,
                       var_path="path",
                       var_conv="total_conversions",
                       var_value="total_conversion_value",
                       var_null="total_null",
                       cha_sep=">")

markov_att_val = res_markov["attribution"]
Using the result from the markov_model, we proceed to allocate the budget using the budget_allocation function. This function allows for dynamic budget allocation by adjusting the spend per channel based on their effectiveness:
res_budget=budget_allocation(tab_attribution=markov_att_val,
                                                       tab_costs=None,tab_index=None,
                                                       total_budget_new=total_budget_new,
                                                       perc_reall=perc_reall,
                                                       server="app.channelattribution.io")
print("Budget Allocation when Costs are not available")
print(res)
This method works even if you don't have specific marketing spending data; just set tab_costs=None. It's flexible and useful when actual spending details are unclear or unavailable.
Here's an example of how the new budget might be distributed across channels:
You can also compare different attribution models to see which one best suits your marketing data and goals. This comparison helps you understand the strengths and limitations of each model in providing valuable insights into your marketing strategies.
The compare_models function allows you to evaluate different models side-by-side, such as heuristic models (like first-click, last-click, linear) and the Markov model. This function measures and contrasts their effectiveness in attributing conversions to various marketing channels.
Here is an example output:
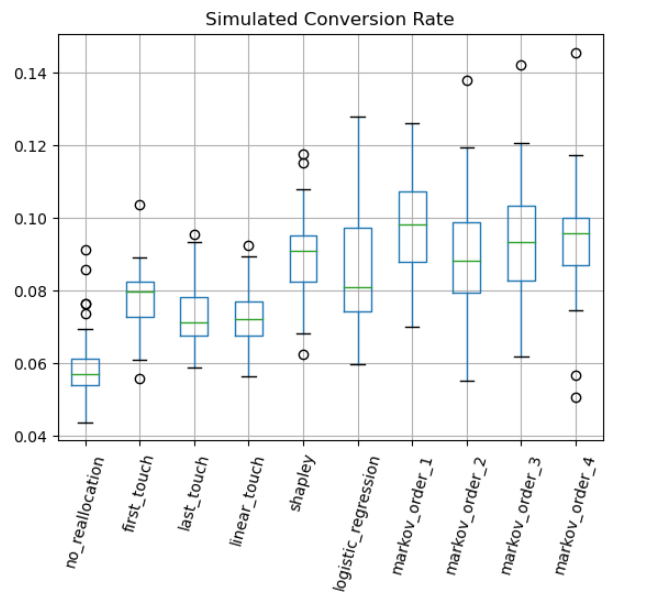
The boxplot illustrates the simulated conversion rates across various attribution models, highlighting important differences:
- No Reallocation: Indicates the lowest performance, underscoring the potential loss in efficiency without budget reallocation based on model insights.
- Heuristic Models: Generally show lower median conversion rates, indicating a potentially oversimplified view of customer paths.
- Linear Model: Offers more stability across touchpoints, reflected in its higher median conversion rate compared to first and last touch.
- Shapley and Logistic Regression: These models present higher median conversion rates, suggesting they capture a more accurate distribution of conversion credits across channels.
- Markov Models: Ranging from Markov_Order_1 to Markov_Order_4, these models show an increase in the precision and effectiveness of conversion attribution as the complexity of the model increases.